


This paper summarizes the progress various industries have made in software productivity during the first decade of the 21st century. It begins by summarizing the productivity gains that occurred from 2000 and 2010 using data from 1,000 completed projects, none of which is over ten years old. Next, it categorizes the project data that were used to make further comparisons in terms of organizational demographics (size of engineering workforces for parent firms), degree of outsourcing, amount of contracting, life cycle stage (requirements, development and/or maintenance) and development paradigm employed (agile, evolutionary, iterative/incremental development, spiral or waterfall). Finally, the factors to which productivity growth seems to be most sensitive to are then identified by industry grouping and discussed as we look into the future to forecast what the next decade has in store for us.
Introduction
The topic of productivity continues to be a concern to those organizations developing software. The reason for this is that most of these groups have invested thousands upon thousands of dollars in processes, methods, tools and training aimed at reducing costs, increasing quality and improving operational effectiveness via productivity improvements. However, questions persist as to whether or not these investments have yielded positive returns. Let us take the case where a small software firm of 30 professionals brings in a new technology like agile methods [1, 2] as an example. When you tally the costs involved, the expenses for new software tools and agile classes alone will average $10,000 per employee when you consider that one full week of time will be needed for training. To achieve a payback of $300,000 a year, as shown in Table 1, this firm will have to achieve a productivity increase of 20% during the first year of the initiative exclusive of other costs. Most proponents would agree that achieving such a yield during the initial year of the move to agile would be highly unlikely due to large learning curves. A two year time window
would be a much more reasonable assumption especially if other costs like mentoring and process changes (daily standup meeting, etc.) were assumed by the analysis.
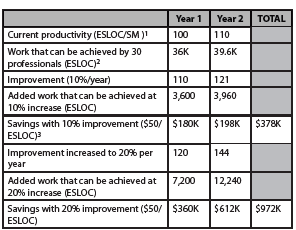
Table 1 – Notional Payback for Agile Initiative
Table 1 Notes
- Assume that productivity increases 10% annually normally
- ESLOC, as will be discussed later in the paper, takes into account reused and legacy code
- The cost of $50/ESLOC was an average taken from the software tools domain for illustrative purposes only
The question that the example raises is how much productivity improvement can you expect to achieve realistically when making such major investments? In addition, what are the productivity norms that you would compare against and how are they computed? These are some of the questions that this paper was written to address.
2 Definition of Productivity
Software productivity is defined by IEEE Standard 1045- 1992 [3] as the ratio of units of output generated to units of input used to generate them. The inputs typically consist of the effort expressed either in staff-months or staff-hours of effort expended to produce a given output. Outputs are most often represented in either source lines of code, function points or some proxy alternative (use case points, story points, feature points, web objects, etc.). Labor is typically scoped from the start of software requirements analysis through delivery i.e., the completion of software integration and test. It includes the following twelve related activities:
- Software requirements analysis
- Software architectural design
- Software implementation
- Software integration and test
- Software development test & evaluation
- Software task management
- Software documentation
- Software version control
- Software peer reviews
- Software quality engineering
- Liaison with other engineering groups
- Integrated product team participation
All directly charged labor is included in this tabulation. For example, labor hours for the leads who charge the project directly are included. Labor hours for executive management who charge overhead or other accounts are excluded as are charges made by the quality assurance staff who report to groups that are independent of the software engineering organization.
For outputs, we use equivalent new logical source lines of code (SLOC). This definition permits modified (including major modifications where changes are greater than 50 percent and minor modifications where alterations are less than 50 percent), reused (software that is designed for reuse) [4], auto-generated/generated code, and code carried over without modification from one build or increment to another to be equated to new source lines (i.e., this a separate category from modified, reused and generated code as it is defined in terms of entire components which are carried forward and used as is without modifications in a software build or delivery). It also allows function point sizing estimates to be related to SLOC counts using industry accepted conversion factors [5] where function points and their variants (feature points, web objects, etc.) are a specification rather than SLOC-based measure of software size.
The formula used to determine equivalent SLOCs, which is expressed as follows, builds on and extends work done by Dr. Barry Boehm for the popular COCOMO-II estimation model [4]:
Equivalent SLOC = New + (0.65) Major Modifications +
(0.35) Minor Modifications + (0.15) Reused + (0.08) Auto-
Generated/Generated + (0.02) Carry-Over
Many issues make counting such inputs and outputs hard [6]. To address these issues, a set of standard counting conventions must be developed and used. The conventions that we adopted for our analysis are based on those devised for the COCOMO-II cost model and are as follows:
- The scope of all projects starts with software requirements analysis and finishes with software delivery, i.e., completion of software development test & evaluation.
-For commercial systems, the scope extends from approval of project startup until sell-off. In other words, the scope for applications systems development extends from product conception to sell-off to the customer.
-For defense systems, the scope extends from the software requirements review until handoff to the system test for hardware and software integration and testing. It assumes that the software deliverables have successfully passed its software development test & evaluation (software selloff).
- Projects can employ any of a variety of methods and practices that range from simple to sophisticated.
- Effort includes all chargeable engineering, management and support labor in the numbers.
-It includes software engineering (requirements, design, programming and test), task management and support personnel (data management, configuration management, network administration, etc.) who charge the project directly.
-It typically does not include independent quality assurance, system or operational test, and beta test personnel who charge their time to accounts other than software. It does include the software effort needed to support those who charge these accounts (liaison, meetings, integrated product team assignments, etc.).
-As an example, the software effort includes version control. However, it does not include the software effort needed to assess the impact of a major change to the system if this is funded through a Program Office account and charged separately.
-As another example, the software effort includes responding to a quality assurance group’s independent assessment of their product if the quality group had a separate charge number which they charged to.
- The average number of hours per staff month was 152 (used to take holidays, vacation, sick leave, etc. into account).
- SLOC is defined by Florac and Carleton [7] to be logical source line of code using the conventions issued by the Software Engineering Institute (SEI) as altered by current practice. All SLOC counts adhere to these counting conventions with the exception of deleted lines which are included in the counts in the same manner as added lines.
- Function point sizes are defined using current International Function Point Users Group (IFPUG) standards.
- Function point sizes were converted to source lines of code (SLOC) using backfiring factors published by various experts as available on their web sites and in the public domain (e.g., see http://sunset.usc.edu/classes/cs510_2011/ECs_2011/ec39-Software%20Sizing.ppt,p. 30).
- Projects used many different life cycle models and methodologies. For example, web projects typically used some form of agile process and lightweight methods, while military projects used more classical waterfall-oriented or incremental processes and methods. Commercial projects used object-oriented methodology predominantly, while military projects used a broader mix of conventional and object-oriented approaches.
- Projects used a variety of programming languages. For example, web projects employed Java, Perl and Visual C while military projects used predominately C/C++.
- Most projects surveyed used more than one programming language on their projects. The cost per SLOC when provided is therefore provided for the predominate language. Some adjustments were made to combine different language generations.
- Dollars used to determine cost are assumed to be constant year 2010 dollars.
- The cost assumed per staff month (SM) of effort of $18,000 assumes an average labor mix and includes all direct labor costs plus applicable overhead, but not general & administrative (G&A) costs and profit. The mix assumes that the average staff experience across the team in the application domain was 5 to 8 years. It assumes that staff has the skills and experience needed with the application, methods and tools used to develop the products.
- Many of the organizations surveyed were trying to exploit commercial off-the-shelf packages, open source software and legacy systems (existing software developed previously whose heritage and quality varied greatly) to reduce the volume of work involved. Piecing the system together and making it work were a challenge.
- Most of the defense and government organizations surveyed were rated at CMMI Level 4 or greater, while most commercial firms were not [8]. For the most part, the processes that commercial organizations used were mostly ISO certified.
Productivity and Quality
Productivity can easily be manipulated by eliminating tasks within the scope identified and altering definitions. For example, including comments and/or blank lines in the definition of a source line of code (SLOC) can effectively increase size by 20 to 40 percent based on which programming language(s) is being employed. As another example, limiting scope to extend from detailed design through software testing results in productivity numbers that are 40 to 60 percent higher because they involve a smaller percentage of the total software development effort. As a final example, productivity numbers for software maintenance are much higher than the actuals because they do not include the entire effort within their scope. Because these maintenance numbers include only the numbers for the generating new releases, they appear to have higher productivity than they should [9]. In reality, they should also include the effort required to sustain the older versions of the software in the field within their scope. They should also address the effort that the maintenance staff expends to sustain the platforms and facilities to get a true picture of the actual productivity that the organization is achieving.
In addition, productivity can also be easily increased by manipulating quality. For example, increasing the defect density from our current norm of measurement of 1 to 3 to a rate of 3 to 10 defects/thousand equivalent source lines of code (EKSLOC) upon release of the software to the field can result in productivity increases of between 18 to 40 percent for a telecommunications application of between 100 and 250 EKSLOC. In many cases, such quality degradations occur inadvertently when the products are released to the field prematurely due to deadline pressures.
Productivity and Cost
Finally, many people confuse productivity improvement with cost reduction. Productivity and cost in terms of effort expended to generate a software product are separable issues because the factors that influence them are different. For example, the easiest way to increase productivity is to get staff to generate more output per unit of input using automation and tools. In contrast, costs can most easily be cut by outsourcing the work overseas to reduce labor costs.
You can validate the concept that productivity and cost are related but separable variables by realizing that you can increase both at the same time by being very productive generating the
wrong thing. This phenomenon becomes apparent when your team generates the wrong product very efficiently because it failed to capture the right requirements.
3 Data and Data Bases Employed
In many people’s minds, the key to determining productivity, cost and quality relationships is to basing your results on empirical data. Over the past 30 years, I have gathered data from over 100 software development shops via data exchange agreements. In exchange for their data, we provide them productivity norms classified by industrial sector and application domain. They use these norms to determine how well they are performing relative to their industry and competition. As part of the agreement, we sign legal documents that define how we will protect the data because the data is considered very proprietary. This makes sense because these firms do not want their competition to know what their current productivity is and what their actual cost and quality
norms are. As a result, we can neither share the details of our databases nor the data contained within them. We can only share our analysis results.
Some have criticized this practice of presenting data without providing the details because they distrust results that they cannot see, replicate and validate. Others are happy to have benchmarks that they can compare their own baselines against even if there is no access to the underlying data used to determine the benchmarks. Because we believe some in the community can use our results, we have supplied it. However, we advise making an effort to validate these benchmarks against your own numbers. There will be critics who will question the source of the numbers especially if the benchmarks do not tell the story that the critics want to recite.
Data Bases
Table 2 summarizes the range of actual software productivity experienced during 2010 along with their range of size and defect densities for 1,000 projects within our databases by industrial sector and application domain for the 93 current organizations from which we currently gather data. Please note that the 2000 database [10] was characterized differently and as such some of the entries associated with it had to be adjusted for normalization purposes. In addition, the project tallies and size ranges in the Table pertain to the 2010 database, not the 2000 entries. Finally, note that the entries in the two databases can only be normalized and compared when they have a like scope and definitions.
The division between firms within the commercial and defense sectors is about 75:25. All of the data have been refreshed so that no data point is more than 10 years old in the 2010 database. In addition, Table 2 includes relatively large amount of new data in the 2010 database supplied by seven new organizations, all of which are commercial. The industrial sectors included are:
- Commercial – firms within this sector include those profit-making organizations that design, develop, field, maintain and sustain Information Technology (IT) products and services. In some cases, these organizations may manufacture and sell such systems commercially. In others, they may integrate and use products supplied by others to automate their systems and procedures (production control, finance and accounting, travel, etc.).
- Defense – firms within this sector include those profitmaking organizations that design, develop, field, maintain and/or sustain systems used by the military for a full range of weapons system (fire control, mission planning, sensor data processing, situation awareness, etc.) and support (medical, information systems like billings, etc.). Such systems tend to be more complex than their commercial counterpart primarily because they involve safety and security issues.
For Table 2, defect density in the table refers to the number of defects per thousand lines of code (d/KSLOC) measured after delivery. KSLOC in this context is measured in equivalent lines of code to take modified, reused, generated and carryover code into account as noted earlier in the COCOMO II discussion. While there has been some work aimed at identifying how many defects developers should expect as they generate software products, these benchmarks vary a great deal as a function of process. However, these developmental defect rates can be used very effectively when the software process is controlled (i.e., as a function of process maturity) to predict the number of defects remaining in a build. This metric gives developers insight into whether they have tested enough assuming that they have set some goal for the numbers of defects remaining at delivery.
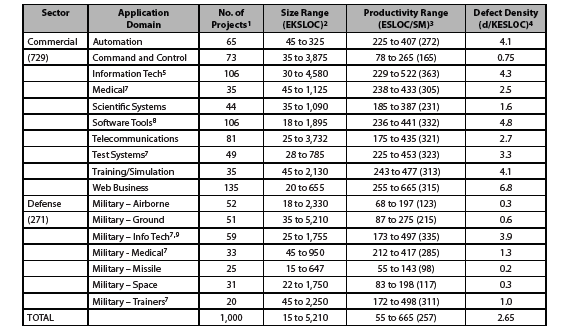
Table 2 – Number of Projects by Domain and Industrial Sector (2010)
Table 2 Notes
- Projects are software development activities that result in delivery of a product to a customer. Under certain circumstances, theycan include increments when they are delivered to the customer for interim use as other increments are being developed.
- Size in equivalent KSLOC uses the approach in Section 1 to address the following five categories of code: new, modified (segmented by major and minor changes), reused (designed for reuse), generated and carry-over (refactored for use as-is with no modifications; e.g., build 1 code used in build 2).
- Range of productivity for these 2010 benchmarks have the average value denoted in parentheses. The definition of the life cycle scope and what labor is included in the computation is as noted in Section 1.
- Refers to the average number of defects per thousand SLOC after delivery. These defect rates have held relatively constant across the decade because they have been established as goals of the development.
- Was Data Processing in the 2000 benchmark article.
- Most of the data collected for these benchmarks were submitted using function points. Function points were converted to lines of code so that measures reported could be normalized. Conversion factors were developed to take into account the mix of programming languages employed, reuse and other factors based on guidance provided by IFPUG (International Function Point Users Group).
- These five applications domains are new for the 2010 benchmark.
- Was Environments/Tools in 2000 benchmark article.
- The root cause of productivity being substantially lower in the military-info tech domain than its commercial counterpart revolves around the amount of rigor and degree of governance applied, not the defect rates established as goals.
As summarized Figure 1, the net productivity improvement across the decade ranges from between 2 to 3 percent per year independent of whatever was viewed as the newest software salvation. Table 3 summarizes the degree of software productivity improvement experienced by sector and application domain using the norms established in 2000 that are noted in the Table and used as our basis for increases [10]. The reason the rate is lower than might be expected is that current requirements are tougher and software products that we are building are getting bigger and more complex. Based on these findings, the community needs to set more realistic goals as they continuously introduce technology to make it easier to develop our products (i.e., our make technology). However, even at such levels these modified productivity improvement goals are sufficient to expend funds on new technology especially when compelling technical and economic arguments are made to justify investments [11]. However, you will need to select the technologies carefully and take charge of the risk involved in making the systematic transition to its widespread use [12]. Else, the technology you try to use may rapidly overwhelm you and your chances of success will diminish accordingly.
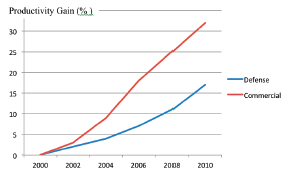
Figure 1 – Trends in Productivity Improvement by Sector during the last Decade
As shown in Table 3, commercial projects have experienced a 31.8% gain in software productivity over the decade, while defense projects improved about half of that at 17.1%. The contributing factors to these large differences in software productivity improvement during the last decade between these two sectors revolve around the software development and management practices used (including the degree of automation), reliability expectations, complexity of the product, and workforce influences. For example, defense firms have taken a more conservative approach when it comes to adopting agile methods because of the nature of their business which is governed by acquisition regulations and contract law.
Based on their underlying nature and use, defense systems tend to be larger, more complex and have higher reliability expectations than their commercial counterparts. The practices used during the decade have gotten leaner and more agile [2]. Automation has become widely used during development for tasks like refactoring [13] and testing [14]. During the decade, workforce issues have dominated as firms have strived to address the economic downturn by cutting their costs through out-sourcing and increasing their productivity through the use of automation and packaged software.
While these factors will not change during the next decade, the systems that we work on will. Systems will continue to become more and more distributed as will the workforces that will be used to develop them. Social media and new forms of collaboration will be developed to address the needs of the ever expanding global community developing software. System-of-system principles [15] will dominate the engineering solutions that will evolve that will exploit such new solutions as cloud computing, social networking and model-based software development. As a consequence of these actions, systems and software engineering will continue to converge especially when building software-intensive systems and new more agile and lean engineering methods will be developed to accelerate getting products to market at reasonable costs.
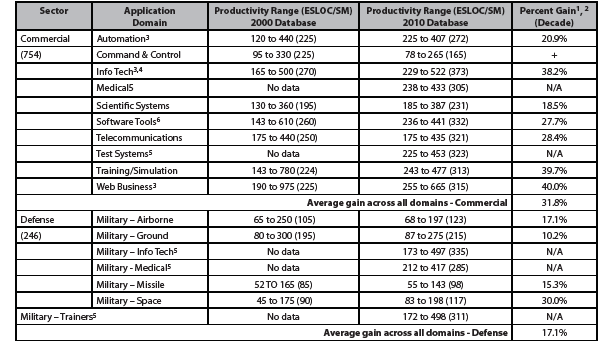
Table 3 – Productivity Improvement by Domain and Industrial Sector from 2000 to 2010
Table 3 Notes
- The types of command and control projects included in the 2000 and 2010 databases were defined differently in that the former included several instances that were reclassified as automation and process control. The number of process control entries in the 2000 database brought the average much higher. If these projects were eliminated, the productivity would have been on the order of 135 ESLOC/SM. However, we do not believe the results are comparable because different technology was used.
- Gain within an application domain is calculated as (2010 – 2000 entries)/2000 entry. Overall gain is computed as the weighted average across all domains for which we have entries in both databases.
- Because the data were refreshed to keep it current, few of the projects included in the 2000 database appear in the 2010 database.
- Average productivity in 2000 was changed in the Table due to normalization.
- Was Data Processing in the 2000 benchmark article.
- These five applications domains are new for the 2010 benchmark.
- Was Environments/Tools in 2000 benchmark article.
Application domains employed are characterized in Table 4 to provide a more complete description of the types of projects within our databases. It is important to note that developing application domain specific numbers allows us to improve our statistical accuracy.
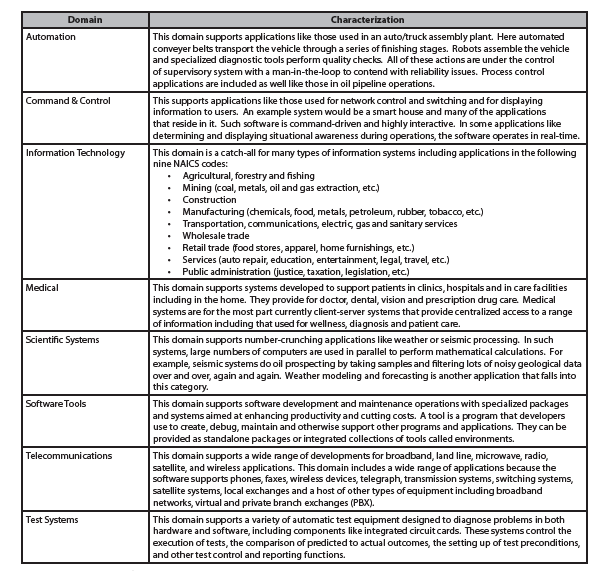
Table 4 – Characterization of Application Domains (continued on next page)
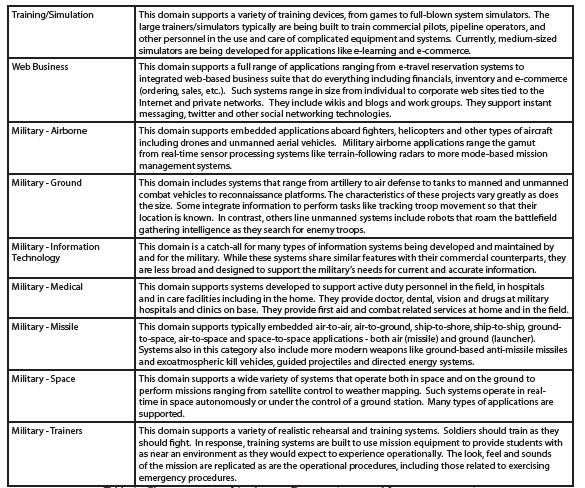
Table 4 – Characterization of Application Domains (continued from previous page)
4 More about the Data
The data that these findings and forecasts were predicated upon was compiled from 93 leading organizations in many industries across the United States. As shown in Figure 2, the size of the engineering workforces involved in supplying the 1,000 project data points used ranged from twenty to thousands of engineers using the classifications that follow:
- Small – less than one hundred engineering employees.
- Medium – between one hundred and five hundred engineering employees.
- Large – over five hundred engineering employees.
Counts used do not assume that employees were in a single location. However, all of the locations surveyed as part of the effort were within the United States. In some cases, contractors that were working as members of software teams were included within the counts because these personnel fulfilled roles that employees normally performed during the development. In these cases, it seemed easier for the organization involved to get money than staff authorizations.
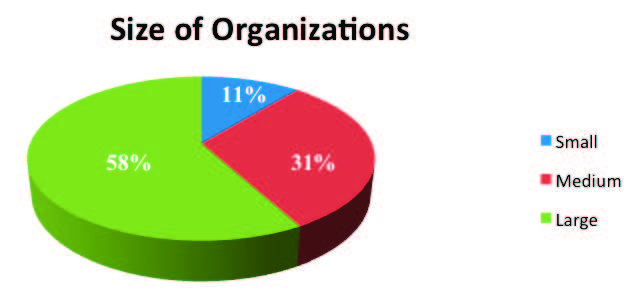
Figure 2 – Size of Engineering Workforces
For the most part, the staff working defense projects was more experienced than those working commercial ones. So were staff members performing maintenance rather than development tasks; i.e., the maintenance teams had 8 years versus 4 years of average experience. Figure 3 highlights the comparison between commercial and defense projects by summarizing the average years of experience taken from our 1,000 project database.
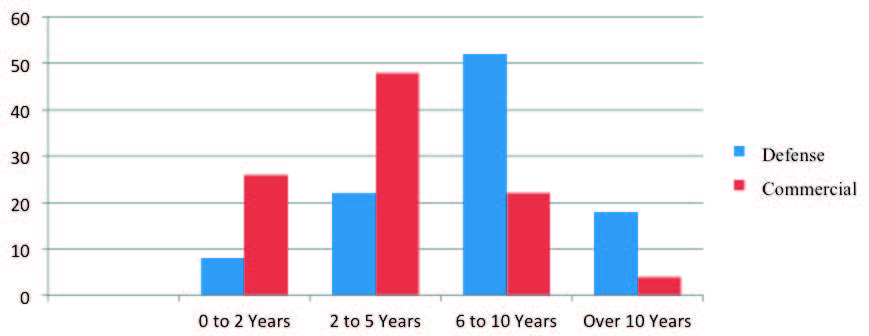
Figure 3 – Average Workforce Experience
The software development paradigm used to develop software has changed radically during the past decade within the commercial sector. A software paradigm consists of a framework for modeling software development consisting of a set of activities, methods, practices, reviews and transformations programmers use to develop software and associated products. As shown in Figure 4, commercial and defense firms differed greatly in the paradigms that they used (see below for definitions) to get their software development projects completed:
- Waterfall Process – refers to a sequential software development process in which progress is seen as flowing steadily downwards (like a waterfall) through a series of phases like analysis, design, implementation, testing, qualification, delivery and maintenance. Providing feedback between phases and using well defined milestones to gate the transitions between stages are viewed as the keys to success with this paradigm [16].
- Iterative or Incremental Process – refers to a cyclical software development process in which progress is made in iterations like builds or releases after the initial planning and analysis is completed. A build is defined for these purposes as a group of programs that are integrated, tested and qualified before delivery to the client. Deployment is made iteratively with cyclical interactions focusing on addressing feedback into builds or releases [17].
- Iterative or Incremental Process – refers to a cyclical software development process in which progress is made in iterations like builds or releases after the initial planning and analysis is completed. A build is defined for these purposes as a group of programs that are integrated, tested and qualified before delivery to the client. Deployment is made iteratively with cyclical interactions focusing on addressing feedback into builds or releases [17].
- Evolutionary – refers to a cyclical software development process where feedback is passed from one evolution of the system (could be either an increment or spiral) to another using a well-defined and disciplined set of practices [19].
- Agile – refers to a group of modern software development methodologies based on iterative development, where requirements and solutions evolve through collaboration between self-organizing, cross-functional teams. Several agile varieties ranging from those that focus on defining tests first to those that start by defining requirements employing user stories [20].
- Hybrid – some unique combination of any of the paradigms listed above whose aim is to take advantage of them when developing software.
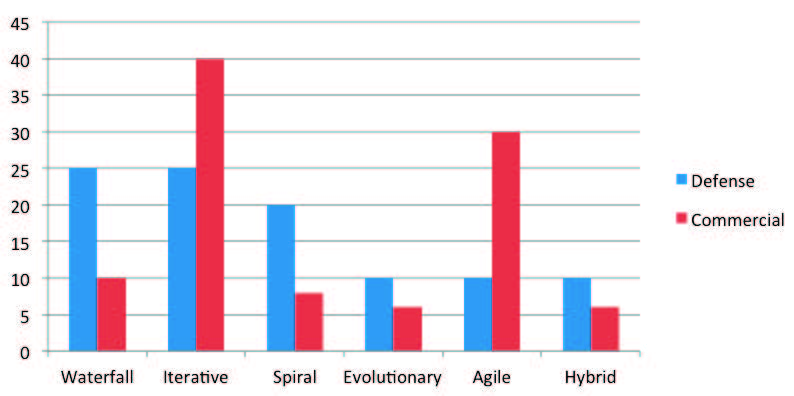
Figure 4 – Distribution of Software Paradigm Employed During Development by Sector
The totals in Figure 4 did not originally sum to one hundred percent in some cases. The reason for this is that some projects in our databases used multiple paradigms. During the early stages, they developed the software incrementally. Then, as the system matured and was fielded, they switched to a waterfall approach because the risk was acceptable. In other cases, parts of the system like servers were developed incrementally, while other parts like clients and web applications used agile methods for their development paradigm. For ease of use, we have normalized all both the defense and commercial entries to total one hundred percent each.
Many people have asked me what the differences in productivity were when using agile and other paradigms. My answer has been that it depends. The reason for this is most agile projects that were captured in our database in the 2000 to 2008 timeframe were small and it was hard to compare them with others that were much larger in scale. However, we started to get larger project after 2008 and have included Figure 5 to illustrate the comparisons for both the defense (18 projects, 6 each methodology) and commercial (48 projects, 16 each methodology) sectors across all applications domains for projects that were less than 250 EKSLOC. It seems that moving smartly to agile seems cost-effective based on the benefits derived through increased software productivity.
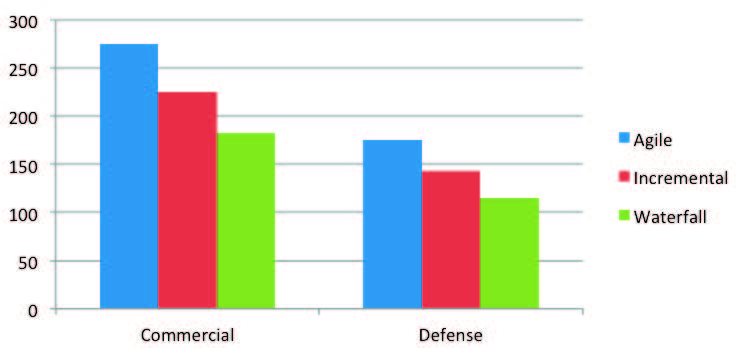
Figure 5 – Productivity Comparison based on Development Paradigm
Figure 5 Notes
- Software productivity reported for paradigms using definitions and scope in Part 1 of this article using SLOC/PM.
- Agile projects are for the most part being done using Scrum methodology as it seems to scale for use on larger projects [2].
Another of the factors that influenced software productivity was degree of in-sourcing and out-sourcing. Due to the economic downturn during the past decade, commercial firms have increased out-sourcing software work overseas. In other cases, they use H-1B visas to bring qualified personnel into the United States to do specific software jobs at wages less than the prevailing salaries in the marketplace. Costs are definitely cut by such practices, sometimes by as much as two to ten. However, cultural issues, communications and increased management burden can cause resulting productivity to be less than expected for teams residing in the United States. However, most firms using out-sourcing have addressed these issues and the practice is viewed as cost-effective based on the prevalence of the approach as illustrated in Figure 6.
It should be noted that many defense organizations have resisted out-sourcing primarily because of security issues. They use United States citizens exclusively to do the work because of its sensitivity. In other cases, both commercial and defense firms have resorted to in-sourcing work to address their staffing needs and reduce costs (i.e., hired contractors to work in-house as members of their teams). Off-loading work to residents (both citizens and sometimes green card holders) reduces management and communications burdens and permits productivity to rise naturally. Even though in-sourcing only lowers the labor costs by a factor of 20 to 50 percent, it tends to improve teamwork and productivity thereby making the practice cost-effective for many of firms involved in our data collection.
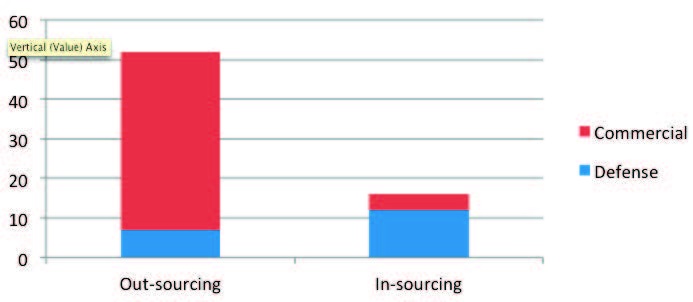
Figure 6 – In-Sourcing versus Out-Sourcing by Sector
5 Factor Analysis
As we mentioned earlier in this paper, productivity improvement is sensitive to a number of factors. The factors around which most of the variation in productivity revolves by sector and their impacts are summarized in Table 1. It is interesting to note that several of these factors have changed during the decade. The most prominent of these has been growth in size and complexity of the products and the relaxation of process improvement mandates. The simplest explanation for the relapse of the process mandate is that the firms that embraced the movement have for the most part achieved their goal of achieving high levels of maturity using either the CMMI or ISO model as their basis for evaluation. The other prevalent explanation is that firms have moved to agile because they felt that process improvement methodologies were too rigid and some balance between discipline and agility was needed [21].
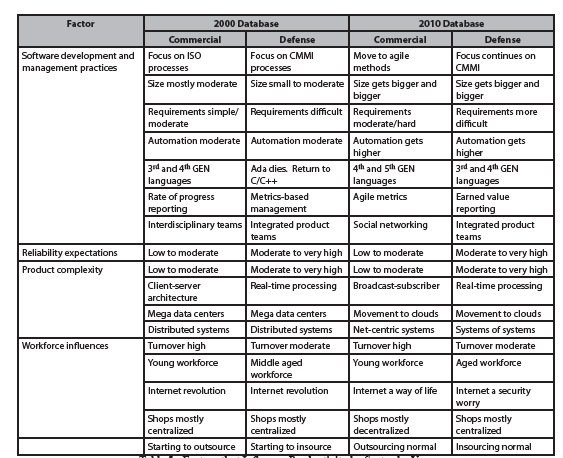
Table 5 – Factors that Influence Productivity by Sector by Year
As shown in Table 5, the continued advance of technology has had a profound impact on how we get the work associated with software projects done during the past decade. For example, the use of the Internet has facilitated the ability of geographically-dispersed teams to work together in virtual space to build products. Along with the good, the use of such technology also created problems. For example, working in virtual space has amplified the need for new forms of collaboration and tighter network security. In contrast, the advent of the use of social networking altered how our teams communicate with each other, clients and collaborators, both actual and potential. Finally, security in general has become a bigger issue as we store information in the clouds and share it across virtual space.
6 Data Validation
Many people have questioned the validity of my databases over the years mainly because they could not independently review the data entries. As anyone who has dealt with data knows, firms treat their productivity, cost and quality actuals as proprietary. Any leakage could create damage especially if they fell into the hands of competitors who used them to win competitive bids. As a consequence, those who receive data must protect it. To release it requires supplier approval. In our case, this is an almost impossible task because it means that we would need to solicit the approval of as many 93 organizations before we could make it made public.
Of course, we validate the data as we receive it to ensure that it conforms to the conventions that we have set for its definition. If there are holes or inconsistencies in the data, we interact with the supplier to resolve the issues we have found prior to entering it into our databases. Once a new dataset is formed, we look for outliers and test it statistically. We also perform hypothesis testing and look to determine the statistical errors.
With the data tightly held, how would you go about validating our conclusions? The easiest answer to these questions is by comparison against your and others’ results. While some productivity data has been made available by others like Capers Jones [22], the only productivity databases that I know that are maintained and kept up-to-date are those sold by the DACS (Data & Analysis Center for Software) [23] and International Software Benchmarking Standards Group (ISBSG) [24]. The DACS database has recently been upgraded by the University of Southern California to contain more current results. Figure 7 illustrates how the results reported in this paper compare to similar findings taken from these two sources. Again, the individual data are not available because of the need to maintain privacy. As the Figure illustrates, our findings seem reasonable when you make the effort to compare like data with like data.
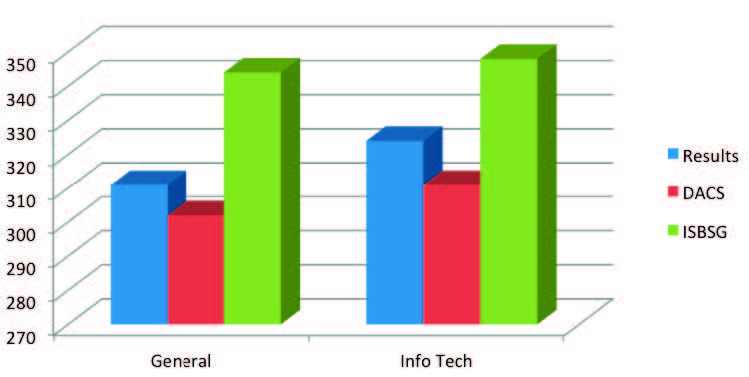
Figure 7 – Comparison of Productivity (SLOC/SM) Findings with DACS and ISBSG Benchmarks
Figure 7 Notes
- Because each of the benchmarks has different scopes, we had to normalize the life cycle phases and labor categories included.
- We made some assumptions about what to include because application domains were defined differently in each of the databases.
- We also converted function point size to source lines of code (SLOC) to ensure all size entries used the same basis.
7 Summary and Conclusions
In summary, the past decade has seen considerable improvements in the technology that most software organizations use to architect, develop, test, manage and maintain their products, both in the defense and commercial sectors. These improvements have in turn sparked software productivity increases that I believe are considerable. While some would be disappointed and say that the magnitude of these increases is not high enough for them, such gains are sufficient for anyone to use to justify major investments in new software techniques, tools and technology. For example, a mere 2 percent gain each year in productivity improvements in a firm that employs 1,000 software engineers justifies millions of dollars in expenditures. I am personally excited about the results and am hopeful that they will continue and accelerate.
I would like to take this opportunity to thank those in the community who have supported my productivity, cost and quality benchmarking activities over the years. They have provided the funding and data that have made it possible for me to be able to provide these results over the years. I would specifically like to thank Mr. Peter McLoone of Lockheed Martin and the DACS staff for their insightful inputs and suggestions for improving this manuscript. Finally, in conclusion, I believe that putting these productivity results in the public domain is important because they provide the community with an empirical basis for comparison. Such comparisons will in turn help those running software organizations and projects to set realistic expectations. I encourage others who have such empirical results to make it public as well. This would enable the community to agree on numbers that everyone could and should use for the community’s benefit.
References
[1] Cockburn, A., Agile Software Development, Addison-Wesley, Upper Saddle River, NJ, 2002.
[2] Cohn, M., Succeeding with Agile, Addison-Wesley,Upper Saddle River, NJ, 2010.
[3] IEEE Computer Society, IEEE Standard for Software Productivity Measurement, IEEE Std 1045-1992,September 17, 1992.
[4] Boehm, B.W., Abts, C., Brown, A.W., Chulani, S., Clark, B.K., Horowitz, E., Madachy, R., Reifer, D. and Steece, B., Software Cost Estimation with COCOMO II, Prentice Hall, Upper Saddle River, NJ, 2000.
[5] Capers Jones published the original table that backfired function points to lines of code in the 1990’s. These tables are now for sale at http://www.spr.com/programming-languages-table.html.
[6] Park, R, Software Size Measurement: A Framework for Counting Source Statement, CMU/SEI-92-20, Software Engineering Institute, Pittsburgh, PA, 1992.
[7] Florac, W.A. and Carleton, A.D. (Editors), Measuring the Software Process, Addison-Wesley, 1999.
[8] NDIA CMMI® Working Group, CMMI® for Small Business, November 2010 (see http://www.ndia.org/Divisions/Divisions/SystemsEngineering/Documents/Committees/CMMI%20Working%20Group/CMMI4SmallBusiness_CMMIWG.pdf).
[9] Reifer, D.J., Software Maintenance Success Recipes, CRC Press, Boca Raton, FL, 2011.
[10] Reifer, D.J., “Let the Numbers Do the Talking,” Crosstalk, March 2002, pp. 4-8.
[11] Reifer, D.J., Making the Software Business Case:Improvement by the Numbers, Addison-Wesley, Upper Saddle River, NJ, 2001.
[12] Reifer, D.J., Software Change Management: Case Studies and Practical Advice, Microsoft Press, Redmond, WA, 2011.
[13] Fields, J., Harvie, S., Fowler, M. and Beck, K., Refactoring: Ruby Edition, Addison-Wesley, 2009.
[14] Kung, D.C., Hsia, P. and Gao, J., Testing Object-Oriented Software (Practitioners), Wiley, IEEE Computer Society Press, 1998.
[15] Jamshidi, M., Systems of Systems Engineering: Principles and Applications, CRC Press, 2008.
[16] Royce, W.W., “Managing the Development of Large Software Systems,” Proceedings Wescon, IEEE, August 1970, pp. 1-9.
[17] Larman, C. and Basili, V., “Iterative and Incremental Development: A Brief History,” Computer, IEEE, June 2003, pp. 2-11.
[18] Boehm, B. W., “A Spiral Model of Software Development and Enhancement,” Computer, IEEE, May 1988, pp.61-72.
[19] May, E.L. and Zimmer, B. A, “The Evolutionary Development Model for Software,” Hewlett Packard Journal, August 1996, available at the following web site: http://www.hpl.hp.com/hpjournal/96aug/aug96a4.pdf.
[20] The Agile Alliance web site provides broad coverage for the methodology at http://www.agilealliance.org/.
[21] Reifer, D. J., Software Change Management: Case Studies and Practical Advice, Microsoft Press, 2011.
[22] Jones, C., Software Assessments, Benchmarks and Best Practices, Addison-Wesley, Upper Saddle River,NJ, 2000.
[23] Information about the Data & Analysis Center for Software (DACS) is available at http://www.thedacs.com/.
[24] Information about the International Software Benchmarking Standards Group (ISBSG) is available at http://www.isbsg.org/.